
The guide
A phone can time a spin cycle, and it will misreport anything much faster
A browser hands over a phone's motion sensor slowly and in coarse steps, which is enough to time a washing machine and far too little to judge a bearing.
- 9.80665 meters per second squared in one standard g, fixed in 1901
- half the rate the fastest vibration a set of samples can show truly
- 12.5 Hz what a spin of 750 revolutions per minute looks like to a sensor
- 1 x rpm where a trouble shooting chart puts a rotor that is out of balance
- 200 Hz the ceiling Android sets on motion sensor data for ordinary apps
Read the full guide Fold the guide
Everything with a motor in it shakes a little. The primer that Brüel & Kjær published for newcomers to the subject starts there: vibration is very difficult to avoid in practice, and out-of-balance forces in rotating parts are among its usual causes. A washing machine in its spin cycle is the household case. Its shaking carries a number, and the phone in your pocket can read it.
Lay the phone on the lid and open a page that asks for its motion sensor. A trace appears, then a few figures: how hard the lid is moving, and how many times a second. Those figures are real measurements. They are also taken through a narrow window, and the useful skill is knowing where the window ends.
What the sensor feels
The primer defines the thing plainly. A body vibrates when it describes an oscillating motion about a reference position, and the number of complete cycles in one second is its frequency, in hertz. Everything after that is a way of saying how large the oscillation is.
There are three ways, and they describe the same motion: how far the surface travels, how fast it moves, and how hard it accelerates. For a steady sine the primer gives the arithmetic. Velocity is acceleration divided by two pi times the frequency, and displacement is velocity divided by the same factor again. So acceleration weights a reading toward its fast components and displacement toward its slow ones. The primer adds that experience favors the overall RMS velocity between 10 and 1,000 Hz as the best single indication of severity.
A phone reports acceleration for a simpler reason. In the accelerometers the primer describes, a small mass pushes on its support with a force proportional to the acceleration, and that force is what gets measured.
Such a sensor cannot tell gravity from motion. Android’s documentation spells out the consequence: a phone lying still on a table reads 9.81 meters per second squared, and one in free fall reads zero. That makes gravity a natural yardstick, and the unit g has an exact size. The General Conference on Weights and Measures declared it in 1901 as 980.665 centimeters per second squared, and NIST lists the same 9.80665 today as exact. The primer concedes that g sits outside the coherent system of units and is still widely used, since a factor of almost ten makes the conversion easy.
To see vibration, gravity has to come out. Android’s guide shows the classic method. A low-pass filter isolates the slow part of the reading, which is gravity, and subtracting it leaves the rest, which amounts to a high-pass filter. The W3C’s explainer on motion sensors notes that most sensor hubs do the separation with the gyroscope instead, which avoids the delay such filters add. A browser may hand over either result. The specification defines one reading with gravity and one without, and either can be missing on a device that cannot supply it.
Two numbers for how hard
A trace that swings a thousand times cannot be quoted, so it is boiled down. The peak is the largest excursion, which the primer calls particularly valuable for short shocks, though it says nothing of what happened in between. The RMS value squares every reading, averages, and takes the root. The primer calls it the most relevant measure, because it follows the whole history of the wave and tracks its energy content.
Divide one by the other and you have the crest factor. For a pure sine it is the square root of two, about 1.414, and a value of 1 means a signal with no peaks at all, such as a square wave. Sharp, isolated knocks raise the peak without adding much to the average, so a crest factor well above 1.41 says the motion is spikier than a smooth wobble.
Here is a case with numbers. A drum spinning at 750 revolutions per minute turns 12.5 times a second, so its imbalance shakes the cabinet at 12.5 Hz. Suppose the phone on the lid shows a peak of 2.0 meters per second squared. That is 2.0 divided by 9.80665, or 0.204 g. If the motion is a clean sine the RMS is 2.0 divided by 1.414, which is 1.41, and the crest factor is 1.41. The tool on this page will reproduce it without a washing machine: set its demonstration to 12.5 Hz and a strength of 2, and it reads 12.5 Hz, 750 cycles per minute, a peak close to 2.0 and an RMS close to 1.41.
The same case shows why the three descriptions differ. Two pi times 12.5 is 78.5, so the velocity amplitude is 2.0 divided by 78.5, about 25 millimeters per second. Divide again and the lid is moving a third of a millimeter each way. A fifth of a g sounds violent. A third of a millimeter does not. Both are the same shake.
Finding the speed from the shake
Real vibration is rarely one sine. The primer describes signals made of very many frequencies at once, impossible to sort by eye, and calls frequency analysis the cornerstone of diagnostic work: plot amplitude against frequency and the periodic parts of a machine stand up as peaks.
Its trouble shooting chart then says which peak to expect. With frequency written as revolutions per minute over 60, rotating members out of balance show their dominant vibration at 1 x rpm, in the radial direction, and the chart calls this a common cause of excess vibration. Misalignment often adds a peak at twice that, and mechanical looseness at twice as well. So the strongest frequency a phone finds on an unbalanced machine, multiplied by 60, is very likely its speed.
Getting a clean peak from a few seconds of samples takes two standard steps. The stretch is first faded in and out with a Hann window, whose first side lobe sits 31.5 dB below the main one, against 13 dB when nothing is done, so a strong tone leaks far less into its neighbors. The spectrum that results has a value only every so often: a four second stretch gives one every quarter of a hertz. A parabola fitted through the top three points places the peak between them. Fitting a parabola to three values round the peak is a recurrent method in the research on estimating frequency.
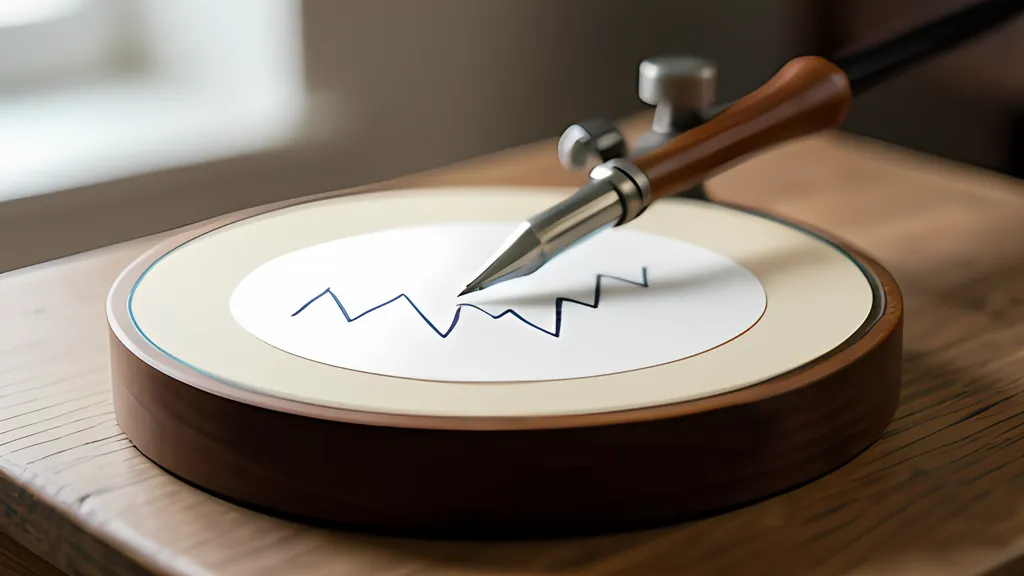
The picture people carry for all this is the seismograph: a pen, a turning drum, a wavering line. The U.S. Geological Survey explains the trick. The instrument shakes with the ground while a mass inside resists by inertia, and what gets recorded is the motion of one against the other. It adds that modern seismographs have dropped the pen and drum for electronics. The picture survives because it is honest about what a trace is.
The narrow window
How often does a browser deliver a reading? The specification says only that the event fires at an implementation-defined interval, and MDN says no more than that it is fired at a regular interval. No rate is promised. A careful tool therefore measures the rate from the time stamps of the events it receives, and reports that.
The rate matters because of a hard rule. The sampling theorem puts it this way: the sample rate must be greater than twice the highest frequency in the signal. Turn that around and a set of samples can show nothing truly above half the rate. Anything faster does not vanish. It appears as a false, lower frequency, found by taking the nearest whole multiple of the sample rate and subtracting. A 70 Hz signal sampled 100 times a second reads 30 Hz.
At 60 readings a second the limit is 30 Hz, and a machine shaking at 45 Hz shows up at 15 Hz, as plausible a number as the true one. The tool’s demonstration will show it: set the frequency to 45 and the display reads 15 Hz, 900 cycles per minute, with a warning beside it. On a real machine there is no warning to give, because the samples alone cannot say which is true.
Why so slow? The W3C explainer names the generic need of games and interfaces as one new reading per rendered frame. Underneath, Android limits apps to 200 Hz for motion sensors unless they declare a special permission, and calls any requested delay only a suggested one. The silicon is far quicker. The driver code Bosch publishes for one of its inertial units, a part it describes as made for mobile devices, defines accelerometer output rates up to 1.6 kHz and ranges from 2 g to 16 g. A page sees none of that directly, only what the browser passes on.
The readings are coarse as well. To make devices harder to fingerprint, the specification has browsers limit the precision of acceleration to 0.1 meters per second squared, about a hundredth of a g. The primer puts the floor of general purpose instruments at one hundredth of a meter per second squared, ten times finer. A faint tremor can sit entirely inside one step of what a page receives.
Time is rounded too. MDN notes that an event’s time stamp records when the event was created, rounded to 0.1 milliseconds in Chrome and to 1 millisecond in Safari and, by default, Firefox. The spacing between readings wobbles, so they must be put back on an even grid before any spectrum is taken. Phones also differ: the phyphox project keeps a public database of the rate, average and noise that submitted devices show at rest. None of it starts unasked. On browsers that guard motion data, MDN says, the permission request works only from a press. Chrome’s guide to its newer sensor interface says readings are accessible only to a visible page.
Good for comparisons, not for verdicts
Within the window, a phone does one job well. The primer says a measured level is judged by comparison with levels measured before or after, that machine troubles are almost always marked by a rise, and that general opinion sets the action level at two to three times normal. Put the phone on the same spot, the same way up, with the same load, before and after the repair. The two readings mean something together even if neither is exact.
What it cannot do is replace an instrument. The primer warns that a probe merely held against a surface can give gross errors and that repeatable results cannot be expected. It also says a sensor should weigh no more than a tenth of the part it sits on. A phone resting loose on a thin panel can break both rules. The frequencies are wrong as well. Much of a machine’s vibration energy lies between 10 and 1,000 Hz, and damaged bearings often show up between 2 and 60 kHz. Even the peak reads low when a crest falls between two readings. A window that closes at 30 Hz sees the spin and little else.
That is still worth having. A number for the spin, a level to compare next month, and a clear idea of what was never measured.
Sources
Every source consulted for this guide. Links checked October 4, 2026.
- Measuring Vibration Brüel & Kjær
- Device Orientation and Motion World Wide Web Consortium (W3C)
- Motion Sensors Explainer World Wide Web Consortium (W3C)
- DeviceMotionEvent MDN Web Docs (Mozilla)
- Window: devicemotion event MDN Web Docs (Mozilla)
- DeviceMotionEvent: requestPermission() static method MDN Web Docs (Mozilla)
- Event: timeStamp property MDN Web Docs (Mozilla)
- Sensors for the web Chrome for Developers (Google)
- Motion sensors Android Developers (Google)
- Sensors Overview Android Developers (Google)
- CODATA Value: standard acceleration of gravity National Institute of Standards and Technology (NIST)
- Declaration 2 of the 3rd CGPM (1901) Bureau International des Poids et Mesures (BIPM)
- Nyquist-Shannon sampling theorem Wikipedia
- Aliasing Wikipedia
- Hann function Wikipedia
- Accurate frequency estimation through iterative parabolic interpolations Togni, Zannoni and Tortora, Signal Processing, vol. 237 (2025), article 110094, record and abstract at OpenAlex
- BMI270 Sensor API (bmi2_defs.h) Bosch Sensortec, repository on GitHub
- Seismometers, seismographs, seismograms - what's the difference? How do they work? U.S. Geological Survey
- phyphox Sensor Database phyphox
- Crest factor Wikipedia