
The guide
A traffic jam needs no accident: a little too much braking is enough to stop a road
In 2008 a ring of cars with nothing in their way jammed by themselves. Two small models, one made of cells and one of smooth equations, show why crowded traffic is unstable and why the jam travels backward.
- 22 cars, 230 m the 2008 ring experiment: no bottleneck, and a jam formed anyway
- roughly 20 km/h speed at which that jam moved backward around the ring
- Four rules the whole Nagel-Schreckenberg model, applied to every car at once
- 1 / (vmax + 1) critical density of that model without randomness, in cars per cell
- 1,937 cars an hour peak flow in the worked example, against 3,000 without randomness
Read the full guide Fold the guide
Everyone has met the jam with no cause. The traffic slows, crawls, stops, crawls again, and then the road simply clears. No crash, no roadworks, nothing at all to look at.
A physics review of traffic quotes the German name for it, Stau aus dem Nichts: a jam out of nothing. The common belief, as the authors of a famous experiment put it, is that a bottleneck causes a jam. The better explanation is stranger. Dense traffic is unstable in itself. Put enough cars on a road and a jam is what the drivers produce together, without any one of them doing anything wrong.
What follows looks at that claim through two small models. They are teaching models: neither forecasts any real road, and nothing here is advice about driving. Their use is to show how little a jam needs.
A circle with nothing in the way
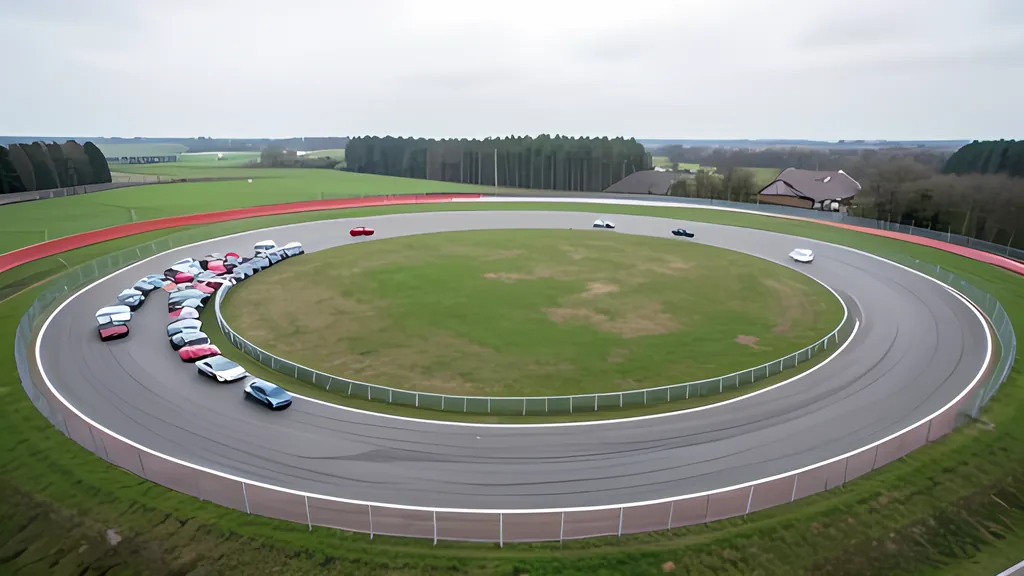
In 2008 Yuki Sugiyama and seven colleagues in Japan published what they called the first experimental evidence for this. They used a circular road on flat ground, put cars on it, and told the drivers only to follow the car ahead safely while trying to hold their cruising speed. The whole apparatus was 22 cars, 230 m of circular track and a camera in the middle looking all the way round.
The cars began evenly spaced at about 30 km/h. For a while that held. Then small differences in the gaps appeared and grew, until the even flow could not be kept and several cars were forced to stop completely for a moment. A cluster of about five standing cars had formed, with the rest of the ring moving freely at around 40 km/h.
The cluster did not stay put. A car at its front pulled away while another arrived at its back, so the jam itself travelled against the traffic, at roughly 20 km/h by the authors’ measurement. They note that this matches the speed of jams measured on real highways, and that a run with 23 cars behaved the same way.
Their conclusion is blunt. A bottleneck is only a trigger. The real origin of a jam is the density: once the average number of cars per kilometre passes a critical value, steady flow cannot survive a tiny fluctuation. A later and larger indoor experiment by the same group, tracked with a laser scanner, found free flow at low density, jams at high density and signs of a state in between that could go either way.
Four rules on a row of cells
Sixteen years before that circle, Kai Nagel and Michael Schreckenberg had built a model that does the same thing with almost nothing in it. The road is a row of cells. Each cell is empty or holds one car, and each car has a whole-number speed from zero up to a maximum. A cell is taken to be about 7.5 m, the room a car occupies in a dense jam, and with a top speed of five cells one step stands for about a second.
Four rules are applied to every car at once, in a fixed order. Speed up by one if below the maximum. Slow down to the number of empty cells ahead if that is smaller, so that no car can hit the one in front. Then, with some probability p, slow down by one more. Finally move forward by the speed just decided.
The third rule is the interesting one. It stands for what is imperfect about a driver: uneven acceleration, and a touch too much brake when slowing. A review of the field by Chowdhury, Santen and Schadschneider spells out the consequence. A car that slows at random may force the one behind to brake, which may then brake a little more by the same rule, and a chain of overreactions can end with a car standing still. That is a jam, started by nobody.
Order matters more than it seems. The same review points out that if the random slowdown is applied before the braking rule instead of after it, the overreaction disappears and so do the spontaneous jams. The model is minimal in a strict sense: remove or reorder any rule and the behaviour that made it famous is gone.
The curve with a corner
The standard picture of a road plots flow against density. Flow is the number of cars passing a point per hour, density is the number of cars on a kilometre, and the two are tied together by one relation that a federal monograph on traffic theory writes as q equals u times k: flow is speed times density. With few cars, adding more raises the flow. Beyond some density the cars get in each other’s way, speed falls faster than density rises, and the flow goes down again. The top of the curve is the capacity.
Engineers have drawn this curve since the 1930s. The same monograph records that the straight-line relation between speed and density published by Greenshields in 1935 rested on half a dozen points near free-flow speed and a single congested observation, taken on a different road. Its author finds it surprising that so simple a result stayed so widely accepted for so long.
In the cell model with the randomness switched off the curve can be written down exactly. If the density is low enough for every car to keep at least the maximum number of empty cells ahead, all of them travel at top speed and the flow is density times top speed. Above that, each car can only move into the empty cells in front of it, and since the gaps of all the cars add up to all the empty cells, the flow is simply one minus the density.
The two straight lines meet at a density of 1 / (vmax + 1) cars per cell, which is the critical density. With the usual top speed of five that is one car in every six cells.
Randomness changes the curve in two ways, both reported by Eisenblaetter and colleagues: the peak is lower, and it moves to a lower density. Here is a case anyone can reproduce in the tool on this page. Put 24 cars on a ring of 120 cells with a top speed of five. That is a density of 0.20 cars a cell, above the critical value of one sixth. With p set to zero the flow settles at exactly 0.8 cars a step, which is 2,880 cars an hour, just as one minus the density predicts. The tool draws its random numbers from a seeded generator that George Marsaglia published in 2003, so any run repeats exactly from its seed.
Now set p to 0.25. Jams appear within seconds, about six of the 24 cars are standing at any moment, and the flow drops to roughly 1,700 cars an hour. Run the density sweep and the measured peak comes out at 1,937 cars an hour, at a density of about 0.12 cars a cell, where the curve without randomness peaks at 3,000 cars an hour at one sixth. A quarter of a chance of braking slightly too much costs the road a third of its capacity.
Why the jam goes backward
Look at one stopped queue. The car at the front has open road and drives off. The car arriving at the back has to stop. So the queue loses a car at the front and gains one at the back, and the block of standing cars creeps upstream even though every car in it only ever moves forward. The earliest theories of these waves, by Lighthill and Whitham in 1955 and by Richards a year later, treated traffic as a fluid and found the same thing: a boundary between light and heavy traffic moves at a speed set by the difference in flow across it, and upstream when the heavy side is ahead.
The backward speed turns out to be oddly constant. Helbing’s review of the field says the propagation speed in congested traffic has a typical value in each country, in the range of 15 km/h give or take 5, and Treiber, Hennecke and Helbing quote about 15 km/h for isolated stop-and-go waves. In the cell model the speed of the jams depends on p alone. A plot of position against time shows it at once: the cars are lines sloping forward, and the jams are dark bands sloping the other way.
Smooth models tell the same story. Car-following theory goes back to work at the General Motors research laboratories in the late 1950s, and it asks a pointed question about any rule for following: if the lead car’s speed wobbles, does the wobble shrink or grow as it passes down the line? If it grows, the monograph notes, a collision would eventually occur somewhere back in the line.
The Intelligent Driver Model of 2000 is a modern rule of this kind, with a desired speed, a time gap, a maximum acceleration, a comfortable braking rate and a minimum gap. Its authors report that with their published values traffic is stable at low and very high densities and unstable in between, and that the instability worsens as acceleration falls or as the time gap shortens.
What the models leave out
Both models have one lane and identical drivers. Nobody overtakes, nobody changes lanes, no ramp feeds in cars except in the crudest way, and every driver follows the same rule for ever. Real roads have trucks, hills, weather, merging, and people who are tired or late. The models cannot say where or when a real road will jam, and their numbers should not be read as measurements of one. They explain a mechanism; they do not predict an afternoon.
The mechanism is worth having, though. Mathematicians have since described these waves as close cousins of detonation waves and given them a name, jamitons, and found them to be states that crowded traffic falls into naturally. And if jams are made collectively, they can be unmade by small means. A paper of 2017 describes the ring experiment repeated on a 260 m track with 21 or 22 cars, one of them driven by a controller designed to calm the waves. The waves were damped, and by the team’s figures fuel use fell by up to 40 percent.
That is the lasting lesson of the circle. The jam was never in any one car. It lived in the spacing between them, which is why one well-controlled vehicle in about twenty can thin it out, and why a road full of drivers, each braking a shade too hard, can build it with no help at all.
Sources
Every source consulted for this guide. Links checked October 7, 2026.
- Traffic jams without bottlenecks - experimental evidence for the physical mechanism of the formation of a jam Yuki Sugiyama and others, New Journal of Physics 10 (2008) 033001, record at OpenAlex
- Phase transition in traffic jam experiment on a circuit Shin-ichi Tadaki and others, New Journal of Physics 15 (2013) 103034, record at OpenAlex
- A cellular automaton model for freeway traffic Kai Nagel and Michael Schreckenberg, Journal de Physique I 2 (12), 1992, record at OpenAlex
- Statistical Physics of Vehicular Traffic and Some Related Systems Debashish Chowdhury, Ludger Santen and Andreas Schadschneider, on arXiv
- Jamming transition in a cellular automaton model for traffic flow B. Eisenblaetter, L. Santen, A. Schadschneider and M. Schreckenberg, on arXiv
- Congested Traffic States in Empirical Observations and Microscopic Simulations Martin Treiber, Ansgar Hennecke and Dirk Helbing, on arXiv
- Traffic and Related Self-Driven Many-Particle Systems Dirk Helbing, on arXiv
- Self-sustained nonlinear waves in traffic flow Morris R. Flynn, Aslan R. Kasimov, Jean-Christophe Nave, Rodolfo R. Rosales and Benjamin Seibold, on arXiv
- Dissipation of stop-and-go waves via control of autonomous vehicles: Field experiments Raphael E. Stern and others, on arXiv
- Revised Monograph on Traffic Flow Theory Federal Highway Administration, U.S. Department of Transportation
- Traffic Stream Characteristics (Revised Monograph on Traffic Flow Theory, chapter 2) Fred L. Hall, published by the Federal Highway Administration
- Car Following Models (Revised Monograph on Traffic Flow Theory, chapter 4) Richard W. Rothery, published by the Federal Highway Administration
- Continuum Flow Models (Revised Monograph on Traffic Flow Theory, chapter 5) Reinhart Kuhne and Panos Michalopoulos, published by the Federal Highway Administration
- Fundamental diagram of traffic flow - Wikipedia Wikipedia
- Xorshift RNGs George Marsaglia, Journal of Statistical Software 8 (14), 2003