
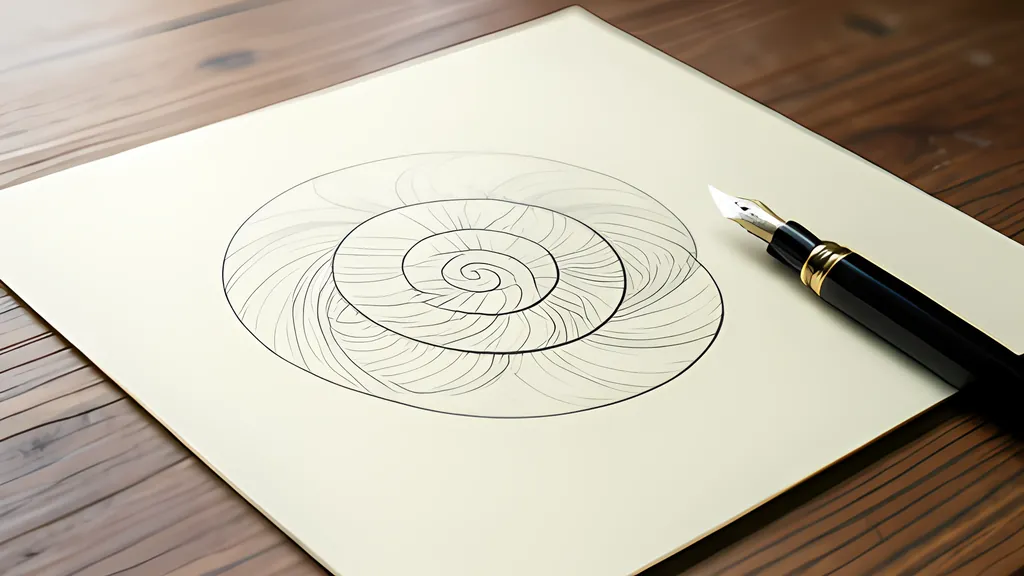
The guide
A harmonograph draws a musical interval, and friction turns it into a spiral
Two pendulums at right angles trace a closed loop whenever their frequencies stand in a simple ratio. Add friction and a slight mistuning, and the loop becomes the drawing that hung in many homes by the 1890s.
- 1857 Lissajous's memoir on the optical study of vibrations
- 3:2 frequency ratio of a perfect fifth, and of a three-by-two figure
- 99.4 cm ideal pendulum that swings once every two seconds
- 115 s for a swing damped at 0.02 per second to fall to a tenth
- 167 s for a fifth mistuned by 0.002 Hz to come back to its shape
Read the full guide Fold the guide
A harmonograph is a table with weights hanging under it. Two pendulums swing through holes in the top, one carrying a pen and the other a sheet of paper, and the pen leaves a line that loops, tightens and finally stops in a dot. Nothing in the machine knows what it is drawing. The picture is decided by two numbers set before the swing begins, and those two numbers are the same two that decide whether a pair of notes sounds like a fifth.
That is why the device is worth more than its prettiness: it is a way of seeing a ratio. The fading, the slow turning and the lace at the center are friction and imprecision laid over it.
Two swings at right angles
Start without friction. Let a point move left and right as a sine of time and, independently, forward and back as another sine. The path it traces is a Lissajous curve, defined by exactly that pair of equations. It is what the equations of a harmonograph become when the damping is removed. Equal frequencies give a line, an ellipse or a circle, depending on how far apart the two swings start. Double one frequency and a suitable phase gives a section of a parabola.
The useful fact is when the curve closes. The rule fits in one line: the pattern closes when the ratio of the two frequencies is rational, a ratio of whole numbers. A ratio of three to two means that after the faster swing has gone across three times the slower has gone twice, both are back where they began, and the pen retraces what it drew. The time that takes is the common period of the two motions.
The ratio can be read off the finished figure. Draw a box around it. In one closure the curve touches each side edge once for every cycle of the side-to-side swing, and the top and bottom once for every cycle of the other. A three to two figure touches three times on the left and right and twice above and below. The count fails only at special phases where the pen doubles back along its own path and touches merge, as on the parabola, which is a closed figure folded flat.
Who drew them first
The curves carry the name of Jules Lissajous, a Paris mathematics teacher, and the MacTutor archive is clear about what he did. In 1855 he described bouncing a beam of light off a mirror fixed to a vibrating object. His 85-page memoir on the optical study of vibrations appeared in 1857, and the same year he showed the experiment at the Royal Institution in London, with Faraday moving the vote of thanks. Light fell on a mirror on one tuning fork, then on a mirror on a second fork set at right angles, and the spot on the screen drew the figure.
He was not first. MacTutor notes that Nathaniel Bowditch had produced the same figures in 1815 with a pendulum hung from two points, which is why some books call them Bowditch curves, and that Lissajous worked independently of him. Lissajous also studied forks tuned slightly apart, where the beats appear on the screen as a rotating ellipse.
The pendulum version has a murkier record, and the sources do not agree. Karl Sims, whose building instructions Wikipedia links to, says the harmonograph is believed to have been invented in 1844 by Hugh Blackburn. MacTutor’s life of Blackburn puts a double-suspension pendulum in his rooms at Trinity College, Cambridge, which he entered in 1841, and where he and William Thomson swung on it. Wikipedia gives 1844 for his description of that pendulum, says James Dean discussed the arrangement and Bowditch analyzed it in 1815, and concludes that the drawing machine cannot be conclusively attributed to one person.
The Science Museum Group in London writes instead that harmonographs were invented in the 1870s, and holds one designed by Arthur Edward Donkin in 1873 that combines two motions with gears and wheels rather than pendulums. And Lissajous, as told above, was drawing the same figures in the 1850s with light in place of a pen. These are not really rival claims about one invention. They are different answers to what counts as a harmonograph: the pendulum, the light beam, or the instrument sold in a box.
The box is well documented. The museum’s example by Newton and Company, dated 1909, has two pendulums on a three-legged stand with the pen on one and the drawing table on the other, swinging at right angles. Its catalog entry adds a dry verdict: by then the instrument was regarded as just a scientific toy for drawing patterns.
What friction adds
A real pendulum loses a little of its swing on every pass. The standard way to write that is to multiply each sine by a decaying exponential, and the equations usually quoted for a harmonograph are exactly that: each coordinate is a sum of sines, each with its own amplitude, frequency, phase and damping. The exponential is the textbook answer for an oscillator whose friction is proportional to its speed. A pen dragging on paper is not obviously that kind of friction, so the exponential is a convenient simplification, not a law of harmonographs.
It is a good one for seeing what happens. The loop no longer closes, because by the time the pen returns it is slightly nearer the center. Each closure sits just inside the last, and the figure becomes a set of nested copies shrinking to a point, which is why a harmonograph drawing ends in a dot.
The second ingredient is mistuning. No builder gets a ratio exactly, and the error does not spoil the figure; it animates it. If one frequency is a little off, the relative phase of the two swings drifts steadily, so the figure passes through every member of its family in turn and appears to rotate, as Lissajous saw. Sims describes the pendulum equivalent: frequencies that differ slightly make the pattern change from circles to lines and back as it decays, giving eye-like designs.
Here is one case with numbers that can be reproduced. Take the standard acceleration of gravity, fixed at 9.80665 meters per second squared since the 1901 weights and measures conference and listed by NIST as exact. A simple pendulum’s period is two pi times the square root of its length over that value. A pendulum swinging once every two seconds is then 99.4 cm long, and one swinging at 0.75 Hz is 44.2 cm.
Those two frequencies stand at three to two, so the frictionless figure closes every 4 seconds. Give both a damping of 0.02 per second and each swing falls to a tenth of its start after 115 s, which is about 29 closures. Now raise the slower pendulum by 0.002 Hz. The figure is no longer closed, and it returns to its starting shape every 167 s, one divided by three times 0.502 minus two times 0.75.
The same ratio, heard
Musical intervals are defined by frequency ratios. A University of Connecticut course on the physics of music puts it plainly: an octave is two to one, a perfect fifth is three to two, written 3:2, and an interval depends only on the ratio, never on the starting pitch. Ross Duffin’s account of Renaissance tuning continues the list with the fourth at four to three, the pure major third at five to four and the minor third at six to five.
So the tie between the drawing and the sound is not mystical. It is the same ratio, shown once to the eye and once to the ear. Multiply 0.5 Hz and 0.75 Hz by 440 and they become 220 Hz and 330 Hz, a fifth. Lissajous built a microscope on this idea, with a tuning fork shaking the lens, to measure the frequency ratio between the fork and a vibrating string with considerable precision.
What the figure cannot do is judge the music. A ratio of seven to eleven closes as neatly as a fifth; it only takes longer and looks busier. Simple ratios close quickly, nothing more.
Rotary machines, wheels and plotters
The lateral machine, pen on one pendulum and paper on the other, is the simplest. Sims’s rotary design uses three. Two lateral pendulums move the pen across and front to back through light arms, and a third hangs in a gimbal under the paper so the sheet can swing in any direction or in circles. He reports that a three to two ratio often gives five-pointed stars and four to three tends to give seven-pointed ones. His table is three feet square.
Tuning is done by sliding the weights. A pendulum’s frequency goes as the inverse square root of its length, so doubling the frequency means a quarter of the length, which Sims notes may not be practical. That is the practical argument for fifths and fourths over octaves.
A pintograph drops the pendulums altogether. Fran McConville, whose daughter coined the name, describes two small motor-driven disks with pivot points to which the drawing arms attach. There is no decay, because the motors keep turning, and the figure comes from the linkage and the two speeds.
None of this needs wood. The same sums run in a few lines of code, and a curve sampled as a chain of short straight pieces is what a pen plotter or an engraver wants. The price is honesty about the model: small swings, a level sheet and tidy exponential friction are assumptions, and a real machine with a sticky pen will disagree with them.
Sources
Every source consulted for this guide. Links checked October 7, 2026.
- Harmonograph - Wikipedia Wikipedia
- How to Make a Three-Pendulum Rotary Harmonograph Karl Sims
- Lissajous curve - Wikipedia Wikipedia
- Jules Lissajous (1822 - 1880) - Biography - MacTutor History of Mathematics J. J. O'Connor and E. F. Robertson, University of St Andrews
- Hugh Blackburn (1823 - 1909) - Biography - MacTutor History of Mathematics J. J. O'Connor and E. F. Robertson, University of St Andrews
- Lissajous Curves - MacTutor History of Mathematics University of St Andrews
- Donkin's Harmonograph | Science Museum Group Collection Science Museum Group
- Harmonograph by Newton, 1909. | Science Museum Group Collection Science Museum Group
- Pendulum - Wikipedia Wikipedia
- Harmonic oscillator - Wikipedia Wikipedia
- CODATA Value: standard acceleration of gravity National Institute of Standards and Technology
- Declaration 2 of the 3rd CGPM (1901) Bureau International des Poids et Mesures
- 3.2 Pythagorean Intervals Department of Physics, University of Connecticut
- Theoretical Background Ross W. Duffin, Just Intonation in Renaissance Theory & Practice, Case Western Reserve University
- Fran McConville's Harmonograph Page Fran McConville